


Short answer: A 13-week cash flow forecast is a week-by-week plan of the cash you expect to collect and pay over the next quarter, starting from today’s bank balance. Each week shows money in, money out and the ending balance, so you see which week cash gets tight while there is still time to act. LUCI Financial Solutions builds and updates these forecasts for Dallas–Fort Worth businesses.
Money in means customer collections and other receipts; money out means payroll, rent, vendors, loan payments, taxes and owner draws. When a week looks tight, the fixes are ordinary: chase a receivable, move a purchase, or line up credit. The forecast only works on reconciled books and a current receivables and payables list, and it is updated every week.
Monthly financial statements tell you what already happened. A cash forecast tells you what is about to happen. Owners who have one rarely get surprised by a payroll week, a quarterly tax payment or a slow-paying client, because they saw it coming weeks earlier.
Key takeaways
- A weekly cash forecast shows the week cash runs short; a monthly report shows it after the fact.
- Start from today’s reconciled bank balance, not from the budget.
- Set a minimum cash floor and watch every week that falls below it.
- Update it weekly: roll the oldest week off, add a new week 13, compare forecast with actual.
- Payroll weeks and quarterly tax payments are where most tight weeks come from.
Why 13 weeks, and why weekly
Thirteen weeks is one quarter. It is long enough to cover the events that strain cash, such as quarterly estimated taxes, an annual insurance premium, a large equipment payment or a seasonal dip, and short enough that the numbers can be based on real invoices and bills rather than guesses.
Weekly matters because cash problems happen inside a month. A business can start and end a month with the same balance and still come up short on the 15th, when payroll lands before the big client payment arrives on the 20th. A monthly forecast averages that problem away. A weekly one shows it.
What goes into the forecast
Every line in a 13-week forecast is cash, not accounting profit. Depreciation, accruals and other non-cash entries stay out. The rows, from the top:
- Opening cash. The actual bank balance at the start of week one, across every operating account. The opening balance of each later week is the ending balance of the week before.
- Collections from customers. Built from the accounts receivable aging, invoice by invoice for the larger ones, placed in the week each customer actually tends to pay, not the week the invoice is due. New sales you expect to bill and collect inside the 13 weeks are added on their own line.
- Other receipts. Loan draws, owner contributions, refunds or asset sales, each on its own line so they are not mistaken for operating cash.
- Payroll. Net pay, payroll taxes and benefits in the weeks they leave the bank, following your actual pay schedule. For most service businesses this is the largest and least flexible outflow.
- Vendor and contractor payments. From the accounts payable aging and the bills you know are coming, in the week you plan to pay them.
- Fixed costs. Rent, software subscriptions, insurance and utilities, on their real due dates.
- Debt service. Loan and line-of-credit payments, principal and interest together, because both leave the bank.
- Taxes. Sales tax remittances and quarterly estimated tax payments in the weeks they are due.
- Owner draws or distributions. They are not an expense on the P&L, but they are very much a cash outflow.
- Ending cash and the minimum balance. Opening cash plus receipts minus payments, compared with a floor you set, such as one payroll plus a cushion. Any week that falls below the floor is the week to plan for.
An example: the week the forecast catches
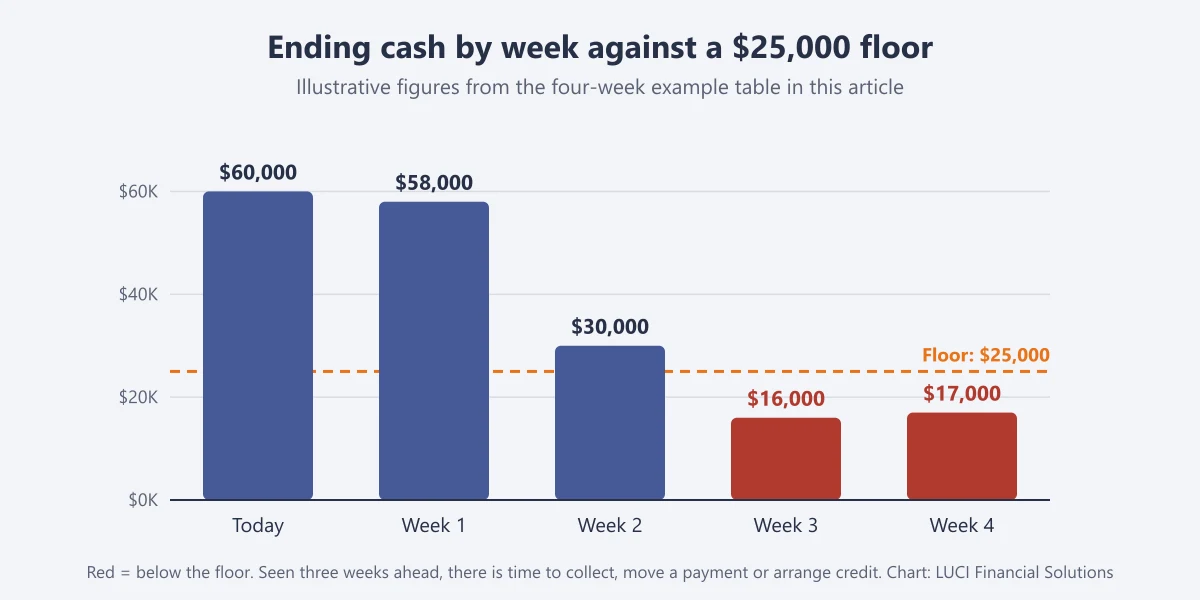
Here is a simple illustration with made-up round numbers, not a client’s figures. A Dallas service company has $60,000 in the bank, pays $38,000 of payroll every other week, and wants to keep at least $25,000 on hand. Four weeks of its forecast look like this:
| Illustrative | Week 1 | Week 2 | Week 3 | Week 4 |
|---|---|---|---|---|
| Opening cash | $60,000 | $58,000 | $30,000 | $16,000 |
| Collections | $22,000 | $18,000 | $9,000 | $46,000 |
| Payroll | −$0 | −$38,000 | −$0 | −$38,000 |
| Vendors, rent, software | −$24,000 | −$8,000 | −$9,000 | −$7,000 |
| Quarterly estimated tax | −$0 | −$0 | −$14,000 | −$0 |
| Ending cash | $58,000 | $30,000 | $16,000 | $17,000 |
How to read this table: follow the ending cash line. Over these four weeks the company collects $95,000 and pays $138,000, because two payrolls and a quarterly tax payment fall inside the same stretch. Weeks 3 and 4 sit below the $25,000 floor, and week 4 carries a payroll. Seen three weeks ahead, the fixes are ordinary: call the client with the largest past-due invoice, move a $10,000 vendor payment by a week with the vendor’s agreement, or arrange to draw on a line of credit. Seen on payday, the options are much worse.
How to build one, step by step
- Reconcile first. Every bank and credit card account matched to its statement through the last month-end. A forecast that starts from a wrong balance is wrong in every week after it. Our month-end close checklist covers this step.
- Pull the aging reports. Accounts receivable and accounts payable, both current. Check that they match the Balance Sheet; if they don’t, the books need attention before the forecast does.
- Learn how each large customer really pays. Look at the last six to twelve months. If a client’s terms are net 30 but they pay in 48 days, forecast 48. This single step makes most forecasts far more accurate.
- Lay out the fixed calendar. Payroll dates, rent, loan payments, insurance, subscriptions and tax due dates for all 13 weeks.
- Add expected new sales conservatively. Only work that is signed or very likely, and collected on your customers’ usual timing, not on the day it is billed.
- Set the minimum balance. Usually at least one payroll plus a cushion for the unexpected. Mark every week that falls below it.
- Roll it forward every week. Replace last week’s forecast with what actually happened, add a new week 13, and look at where the forecast was wrong. That comparison is what makes the next forecast better.
Mistakes that make a forecast useless
- Forecasting from the P&L. Revenue and expenses are recorded when billed and incurred, not when cash moves. A forecast built from profit repeats the gap explained in our guide on why a profitable business can be short on cash.
- Using invoice due dates instead of real payment habits. The forecast looks comfortable and reality does not.
- Leaving out principal, draws and taxes. None of them sit in operating expenses, and all of them leave the bank.
- Building it once. A forecast that is not updated weekly is out of date within a month, and owners stop trusting it.
- Forecasting from books that are behind. If the last close was three months ago, the forecast is resting on old balances. Catch up the books first; our QuickBooks cleanup checklist shows what that involves.
When a business needs a 13-week forecast
Not every business needs one every week. It earns its keep when:
- Payroll is large compared with the cash you usually hold.
- A few large customers make up most of your receivables, and one late payment changes the month.
- You are growing, so you pay for new work before it is collected.
- A big decision is coming: a key hire, a second location, an equipment purchase or a new loan.
- Your bank or lender asks how you will cover a period, or you are relying on a line of credit.
- Revenue is seasonal or project-based, with uneven months.
How LUCI builds cash forecasts for Dallas businesses
Forecasting is only as good as the books under it, which is why LUCI Financial Solutions keeps both with one team. Inday Reo Pedere, our bookkeeper with 7 years in QuickBooks Online, keeps the accounts current and reconciled. Erin Marchbanks, Senior Accountant with 15+ years of experience, runs the month-end close and AP/AR. LaTara Scott, MBA, our Founder & CEO with more than 25 years in accounting and financial operations leadership, turns the closed books into the forecast and walks you through it.
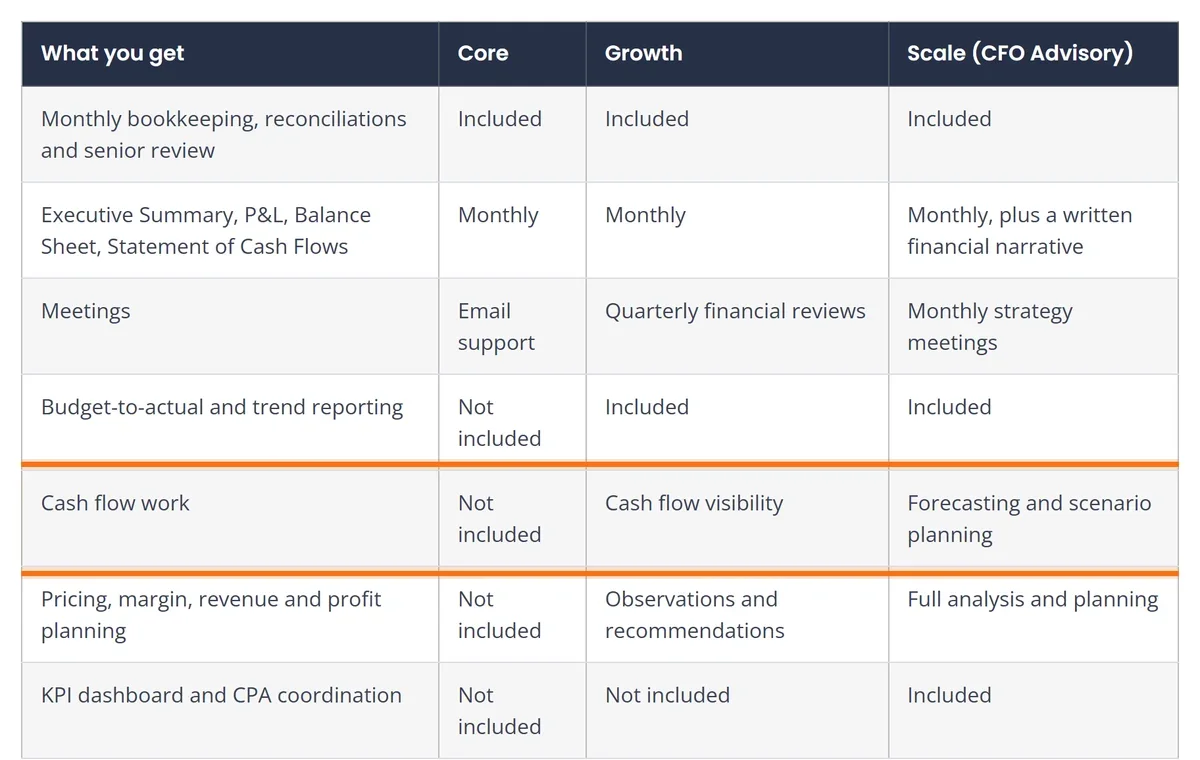
Every tier includes a monthly Statement of Cash Flows. The Growth tier adds cash flow visibility and trend reporting. Cash flow forecasting and scenario planning are part of the Scale tier, our fractional CFO services in Dallas, and are also available as a standalone advisory engagement if your bookkeeping is already in good hands. Fees are a fixed monthly amount proposed after a discovery call, with a three-month initial commitment and month-to-month after that. To see what CFO-level work typically involves and what drives its cost, read our guide on what a fractional CFO in Dallas does and costs.
Frequently asked questions
What is a 13-week cash flow forecast?
It is a week-by-week projection of cash collected and paid over the next quarter, starting from the actual bank balance. Each week shows receipts, payments and the ending balance, so you can see which week cash falls below the minimum you want to keep and act before it happens.
How is a cash forecast different from a budget?
A budget plans revenue and expenses for the year on the same basis as the P&L. A cash forecast tracks when money actually enters and leaves the bank, including items a budget leaves out, such as loan principal, owner draws and the timing of customer payments. Most businesses benefit from both.
How often should a cash forecast be updated?
Weekly. Each week the actual results replace the forecast for the week that just ended, a new week is added at the end, and the differences are reviewed. A forecast that is not updated quickly stops matching reality.
Can I build a cash forecast in QuickBooks?
QuickBooks Online supplies the inputs: reconciled balances and the receivables and payables aging. Many businesses keep the forecast itself in a spreadsheet, where weekly timing and payment habits are easier to adjust. What matters most is that the books feeding it are current and reconciled.
Who in Dallas offers bookkeeping with cash forecasting?
LUCI Financial Solutions provides bookkeeping, month-end close and cash flow forecasting from one team for Dallas–Fort Worth businesses. Forecasting and scenario planning are part of the Scale (CFO Advisory) tier or a standalone advisory engagement, and every tier includes a monthly Statement of Cash Flows.
See tight weeks before they arrive
If cash surprises keep landing on payday, the $597 Financial Review & Assessment is a practical first step: a 60-minute review of your QuickBooks file that ends with a prioritized action plan. For monthly books with cash forecasting on top, schedule a consultation with LUCI Financial Solutions, or call 214-233-5454.