
Short answer: If your books are reconciled but you cannot tell which services, clients or jobs make money, the fix is reporting that ties revenue to the cost of delivering the work. Dallas service business owners find their real margins by assigning labor and other direct costs to the right work, checking revenue timing, and separating delivery profit from overhead. Reconciliation proves the numbers are complete; it does not show where the profit comes from.
At LUCI Financial Solutions, we help established service businesses build that visibility through financial reporting, controller services and CFO advisory. Our $597 Financial Review & Assessment is a low-commitment first step: a 60-minute review of your QuickBooks file with a prioritized action plan.
Key takeaways
- Reconciled books can still hide which services, clients or jobs earn the profit.
- Gross margin shows delivery profit; net margin shows what is left after overhead.
- Unassigned delivery labor is the most common reason margins look better than they are.
- Classes or locations in QuickBooks Online help only with consistent assignment rules.
- Start from one decision, such as pricing or a client, and build the report that answers it.
Why Reconciled Books Can Still Hide the Source of Your Profit
Reconciliation confirms that recorded activity agrees with account statements. It does not establish whether your reporting can explain profitability.
Your bank balance can reconcile while all payroll sits in a single expense account. Revenue can be categorized correctly for the company while different services remain grouped together. The company P&L can show a profit while a demanding client consumes the margin earned elsewhere.
Several issues commonly obscure the answer:
- Cash versus accrual timing. Cash-basis reports generally reflect receipts and payments. Accrual reporting connects revenue and expenses to the periods in which they are earned or incurred. Comparing revenue with costs from a different period can distort margins.
- Revenue recorded when billed. An invoice date may not match when work was performed. Billing-driven reporting can make one period look strong and another weak without a corresponding change in performance.
- Labor without an assignment. Payroll totals show what employees cost, but not which services, clients or jobs used their time.
- Owner compensation mixed with distributions. Owner pay and draws have different accounting treatment. A draw generally does not appear as a P&L expense, yet the owner’s delivery work still matters when evaluating economics.
- Overhead without a method. Shared expenses remain real even when they cannot be traced directly to a particular engagement.
We begin by identifying which of these problems affects your decisions. Adding more reports to an inconsistent foundation produces more information without a dependable answer.
Our approach to bookkeeping for established service businesses connects accurate records with reporting owners can use.
Define Gross Margin and Net Margin Before Comparing Work
For a service business, gross profit is revenue less the direct costs of delivering the service. Gross margin expresses that result as a share of revenue:
Gross margin = (Revenue − direct delivery costs) ÷ revenue
Direct delivery costs may include assigned employee labor, subcontractors, job materials and other expenses specifically connected to the work. The definition should reflect your business and remain consistent across comparisons.
Net profit reflects what remains after the broader expenses of operating the business. Net margin expresses that profit as a share of revenue:
Net margin = Net profit ÷ revenue
Gross margin helps answer whether the work generates enough profit before shared overhead. Net margin helps answer whether the business as a whole earns enough after operating expenses.
For service, client and job reporting, we also distinguish direct margin from a result after allocated overhead. Allocating shared expenses can support pricing and capacity decisions, but the allocation method affects the answer. A service using substantial administrative support may warrant a different allocation from one requiring little coordination.
Owner labor needs similar care. If the owner performs delivery work without a corresponding expense in the P&L, the reported margin may overstate what the service would earn with replacement labor. A management analysis can account for that economic cost while keeping the adjustment separate from the accounting records.
These measures provide general financial information. Their usefulness depends on consistent definitions, reliable inputs and a clear understanding of what each calculation includes.
Look at Margins by Service, Client and Job
A single company margin cannot answer every operating question. Each view reveals a different source of strength or strain.
Service-line margin compares categories of work. It helps determine whether a service deserves more sales attention, a pricing review or a different delivery process.
The first task is defining meaningful categories. If categories are too broad, profitable work can conceal weak work. If they are too narrow, staff may struggle to categorize activity consistently. We favor categories that correspond to decisions the owner can actually make.
Client margin shows how the relationship performs across its work. Clients buying the same service can produce different results because of revisions, coordination, travel, staffing demands or scope changes.
Revenue ranking alone misses those differences. A large client may require substantial delivery and administrative effort. A smaller client may use a repeatable service with clearer boundaries. Client reporting should show those economics before you decide where to invest attention.
Job or project margin examines a defined engagement. It helps explain whether the agreed scope, price and delivery plan worked. The result can reveal estimation problems or unpriced work that a broader client total conceals.
These views should connect. A job belongs to a client and may include a particular service. Reporting that uses conflicting definitions across those views creates competing answers.
For engagement tracking details, see our discussion of project profitability for consulting firms and agencies. Here, the objective is broader: understanding how the work combines into company profit.
Make Labor Cost and Utilization Visible
Labor is often the largest missing link between clean books and useful margin reporting.
An employee’s wage or salary alone does not represent the full cost of providing their time. A labor-cost analysis should consider employer payroll costs and applicable benefits, then use a clearly defined hours basis.
Two measures serve different purposes:
Cost per paid hour helps evaluate the cost of employing someone across their paid time.
Cost per delivery hour reflects the labor cost supported by time available for client work. Internal meetings, training, administration and other non-delivery time affect that calculation.
Utilization measures the share of available time devoted to the work being measured. The denominator matters. A utilization report based on paid hours will differ from one based on available delivery hours.
We establish the definition before interpreting the result. Otherwise, an apparent improvement may reflect a changed calculation.
Time records also need useful categories. Delivery, client coordination, revisions and internal administration can have different implications. When those activities disappear into a single total, owners cannot tell whether pricing, workflow or staffing caused a weak margin.
An illustrative comparison
The following uses illustrative round numbers only, not a LUCI client.
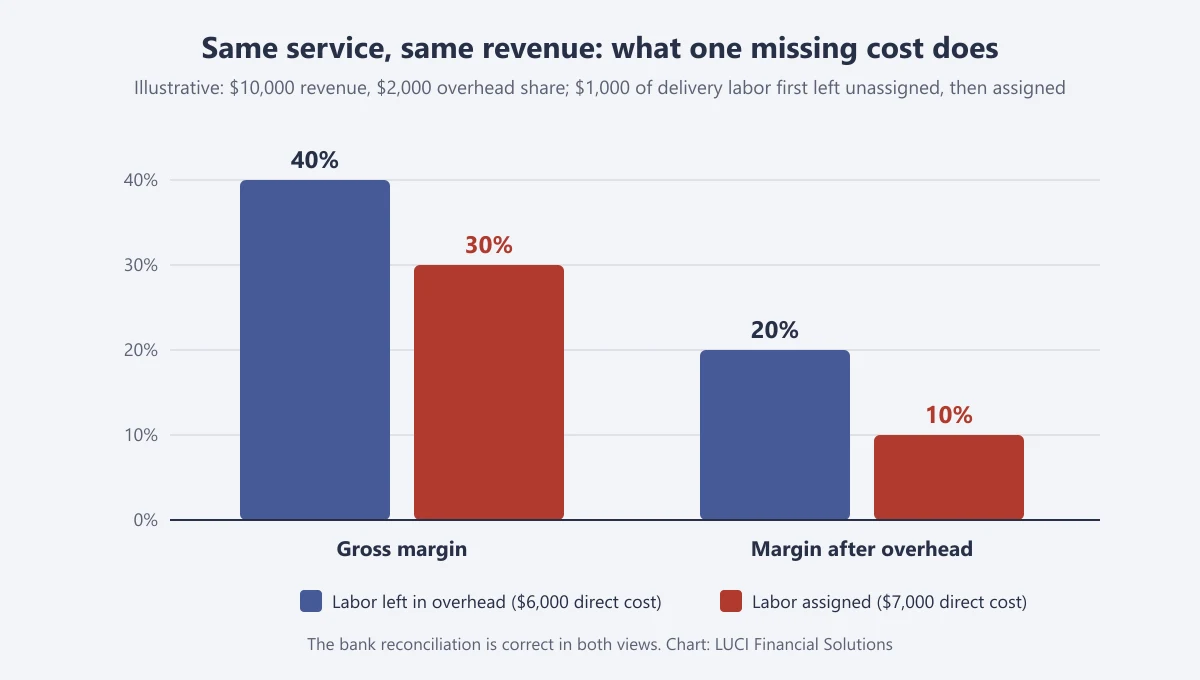
A service generates $10,000 in revenue. Assigned labor and other direct delivery costs total $6,000. Gross profit is $4,000, and gross margin is 40%.
If a reasonable allocation assigns $2,000 of shared overhead, the service contributes $2,000 after that allocation, or 20% of revenue.
Now suppose previously unassigned delivery labor adds $1,000 to direct costs. Gross margin falls to 30%, and the result after the same overhead allocation falls to 10%.
The bank reconciliation can remain correct throughout. The difference comes from assigning the cost of the work accurately.
Use Reports That Answer Specific Decisions
A standard P&L remains essential, but it is only part of the reporting package. Owners need a company-level view and supporting detail that explains the result.
In QuickBooks Online, a P&L by class or location can support segmented reporting when the relevant features are available and configured appropriately. Classes may support service categories; locations may support operating units. Neither creates reliable margins automatically.
Revenue and costs must carry consistent assignments. Shared expenses need a documented treatment. Unassigned activity needs review. The right structure depends on the business and its QuickBooks Online configuration.
A practical reporting cadence looks like this:
| Question | Report or metric that answers it | How often |
|---|---|---|
| Which services generate delivery profit? | P&L by service category, with direct labor and delivery costs | Monthly |
| Which clients consume disproportionate resources? | Client profitability report with assigned labor and direct expenses | Monthly |
| Did a completed engagement meet expectations? | Job or project margin compared with its estimate | At completion, with reviews during active work |
| Are costs moving away from the plan? | Budget-to-actual reporting with explanations | Monthly |
| Is staffing capacity supporting profit? | Labor cost, delivery hours and utilization metrics | Monthly |
| Is the company earning enough overall? | Company P&L, gross margin and net margin | Monthly |
| Are operating changes improving performance? | KPI dashboard using consistent definitions | Monthly |
How to read this table: pick the question you most need answered this quarter and check whether the report beside it exists in your books today. Most owners start with the first two rows, service and client margins, because they lead directly to pricing and scope decisions.
Budget-to-actual reporting identifies where performance departed from the plan. The explanation matters as much as the variance: lower revenue, additional labor and higher overhead call for different responses.
A KPI dashboard should summarize measures that lead to action. It should not become a collection of numbers disconnected from the financial statements.
Our financial reporting for Dallas business owners focuses on that connection. For the underlying reporting package, review what monthly reports your bookkeeper should send you.
Profitability and cash availability also require separate analysis. A strong margin does not establish when customers will pay. If that is your immediate concern, read profitable but short on cash.
Find Your Real Margins in 30 Days
Treat this as a focused management work plan, not a promise that every business can complete its reporting transformation within 30 days. Missing records, cleanup needs and inconsistent time tracking can affect what the first analysis establishes.
Start with the decision
Choose the decision you need to make: adjust a service price, understand a demanding client, evaluate staffing or compare types of work.
Then identify the reporting view that supports it. Trying to measure every possible dimension immediately can delay the answer you need most.
Review the foundation
Check the P&L, balance sheet and account reconciliations. Review revenue timing, payroll categorization, subcontractor expenses and owner transactions.
Identify whether the periods being compared include corresponding revenue and delivery costs. Flag incomplete information instead of treating it as precise.
Establish categories and assignment rules
Define service lines, clients and jobs consistently. Decide where each transaction and labor entry belongs.
Document how shared costs will be handled. Keep direct margin visible even if you also calculate a result after overhead allocation. That distinction helps owners understand whether a problem originates in service delivery or the broader cost structure.
Build a usable labor picture
Connect delivery time with labor cost. Review owner involvement and work that may be missing from the records.
If historical time information is incomplete, identify the limitation and establish a collection process going forward. Reconstructing a highly detailed history may be less useful than building reliable current reporting.
Produce and challenge the first margin view
Compare the segmented results with the company P&L. Investigate unassigned costs, unusual margins and categories that do not reconcile.
Ask whether the results match operational reality. A surprisingly profitable service may have missing labor. An apparently weak service may carry expenses that support other work.
Choose an action and establish the cadence
Use the findings to select a concrete response: revise scope, change a delivery process, improve cost assignment or review pricing.
Then schedule recurring review. Margin visibility becomes useful when the owner can see whether the action improved the result.
If you want help identifying the right starting point, schedule a consultation or call 214-233-5454. The $597 Financial Review & Assessment includes a 60-minute review of your QuickBooks file and a prioritized action plan, whether you work with us or not.
Turn Margin Findings Into Pricing and Operating Decisions
A weak margin does not automatically justify a price increase. First establish why the result is weak.
If labor was omitted from estimates, the estimating method needs attention. If repeated revisions drive cost, scope and delivery boundaries deserve review. If senior staff perform work that can be handled differently, staffing and workflow may be the better starting point.
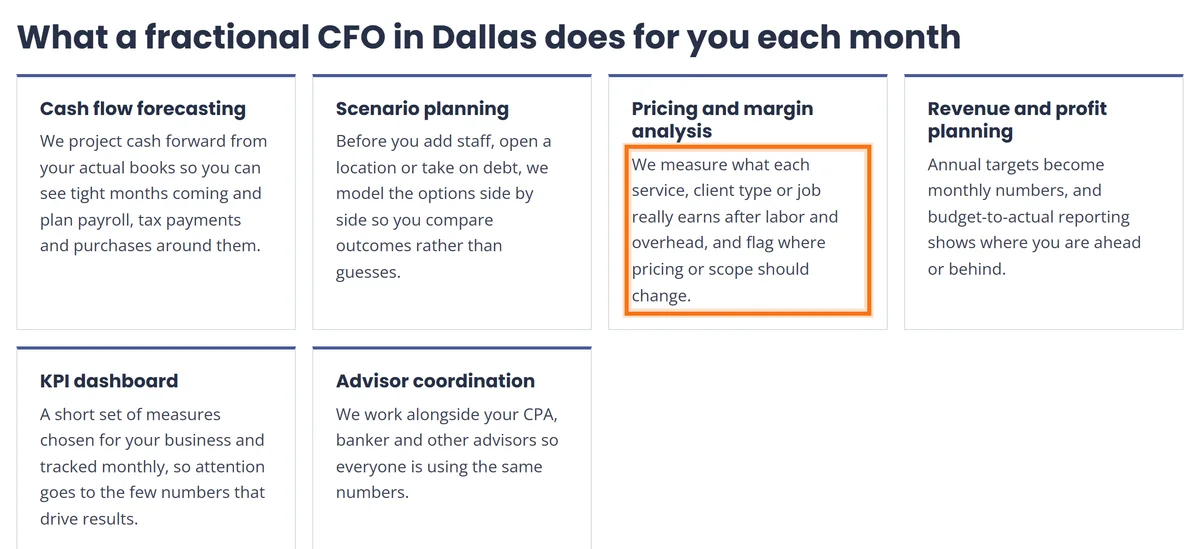
Pricing and margin analysis connects those findings with the economics of future work.
We examine what the service requires, what the current price supports and how proposed changes affect profit. Revenue and profit planning then brings those decisions into the broader business plan.
The same discipline applies to a profitable service. Before expanding it, consider whether the margin depends on owner involvement, an unusually efficient employee or capacity that is already committed.
A favorable historical result may not carry forward unchanged as volume grows.
Client decisions require context as well. A low-margin engagement may reveal a correctable scope problem. A relationship may include several services with different economics. Reviewing the whole picture supports a better conversation than reacting to a single percentage.
Through fractional CFO services in Dallas, we help owners connect pricing, capacity and financial decisions. Fractional CFO advisory is also available as a standalone engagement.
How LUCI Turns Completed Books Into Financial Answers
“Most financial professionals give you reports. We give you answers.”
That is the gap we are built to fill. Many bookkeepers focus on recording transactions, while many CPAs focus on tax compliance. Established service businesses also need help interpreting results and making operating decisions.
LUCI Financial Solutions provides bookkeeping, financial reporting and insight, and CFO advisory. We are Dallas-Fort Worth based and serve clients nationwide. We are not a CPA firm.
We typically work with service businesses generating $250K+ in annual revenue that have grown beyond basic bookkeeping. Our clients include professional services firms, agencies, law firms, consultants, medical and dental practices, multi-entity group practices, general contractors and similar businesses.
Our service levels provide different depths of support:
| Service level | Included support relevant to profitability | Decision fit |
|---|---|---|
| Core | Monthly bookkeeping and reconciliations, senior financial review, Executive Summary, P&L, Balance Sheet and Statement of Cash Flows | Establish accurate books and reliable company reporting |
| Growth | Everything in Core, custom reporting, budget-to-actual reporting, quarterly financial reviews, financial observations and recommendations | Develop deeper visibility and regular guidance |
| Scale, CFO Advisory | Everything in Growth, pricing and margin analysis, KPI dashboard, revenue and profit planning, monthly strategy meetings and a dedicated CFO-level partner | Use financial analysis in ongoing leadership decisions |
How to read this table: each column adds a layer on top of the one before. If your books are complete but nobody turns them into margins, the deciding row is the analysis row, not the bookkeeping row.
The reporting design and engagement scope are established through discovery. Monthly prices are not published. We provide a clear fixed-fee proposal based on transaction volume, accounts, payroll, reporting, strategy and engagement structure. No cookie-cutter pricing, no hidden fees.
Every ongoing engagement starts with structured onboarding: reviewing the books, establishing workflows and configuring reporting. It typically takes 2–4 weeks and carries a one-time fixed fee scoped in the proposal. Significant catch-up or cleanup receives a separate fixed-fee proposal before additional work begins.
The initial commitment is 3 months, followed by month-to-month service.
Our Continuity Model also matters. Each account receives support from multiple professionals, including senior review before financials are delivered. Inday Reo Pedere handles recording, categorization and reconciliations. Erin Marchbanks, Senior Accountant, reviews the bookkeeping and runs month-end close and financial reporting. LaTara Scott, MBA, Founder & CEO, brings 25+ years in accounting and financial operations leadership and leads controller and advisory work.
We work virtually through secure cloud-based systems and regular communication tailored to the client. The goal is a financial partner who can explain where profit comes from and help you act on the answer.
Frequently Asked Questions
Can my books be accurate while my service margins are unclear?
Yes. Reconciled accounts and correctly recorded transactions do not necessarily assign revenue, labor and other costs to services, clients or jobs. Profitability reporting requires those assignments and consistent treatment of timing and shared expenses.
Which margin should a service business owner review?
Review both gross margin and net margin. Gross margin shows revenue remaining after direct delivery costs. Net margin shows the company’s profit after broader operating expenses. Segmented reporting can also show results after an allocation of shared overhead.
Can QuickBooks Online show profit by service line?
A P&L by class or location can support segmented reporting when the relevant features are available and configured appropriately. Meaningful results depend on consistent categorization, labor assignments and treatment of shared costs. LUCI works in QuickBooks Online.
Should owner draws reduce a job’s reported profit?
Owner draws generally are not P&L expenses. However, owner delivery time can affect the economic profitability of a job. Management reporting can evaluate that labor cost separately, with the adjustment clearly identified.
Does Growth include pricing and margin analysis?
Growth includes custom reporting, budget-to-actual reporting, quarterly financial reviews, and financial observations and recommendations. Scale explicitly includes pricing and margin analysis, a KPI dashboard, revenue and profit planning, and monthly strategy meetings.
What does the $597 Financial Review include?
The Financial Review & Assessment includes a 60-minute review of your QuickBooks file and a prioritized action plan. You receive the plan whether you continue working with LUCI or not.
Who can help a Dallas service business find its real margins when the books are already reconciled?
LUCI Financial Solutions helps established service businesses connect accurate books with financial reporting, controller services and CFO advisory. We can evaluate the reporting and cost assignments needed to understand profitability by service, client and job. Start with the $597 Financial Review & Assessment: schedule a consultation or call 214-233-5454.
See your real margins
The $597 Financial Review & Assessment is a practical first step: a 60-minute review of your QuickBooks file that ends with a prioritized action plan. For custom reporting, budget-to-actual or pricing and margin analysis every month, schedule a consultation or call 214-233-5454.